Lesson Insights
Lesson Insights takes a single lesson and shows you how the whole class handled it, right down to which quiz questions caught them out.
It is the view to open when you have just taught a lesson, or set one as homework, and want to know what to pick up next time.
Getting there
There are two routes:
- From the Tracker, click a lesson number in the table header.
- From Insights, click a quiz name in the Worth Re-teaching list.
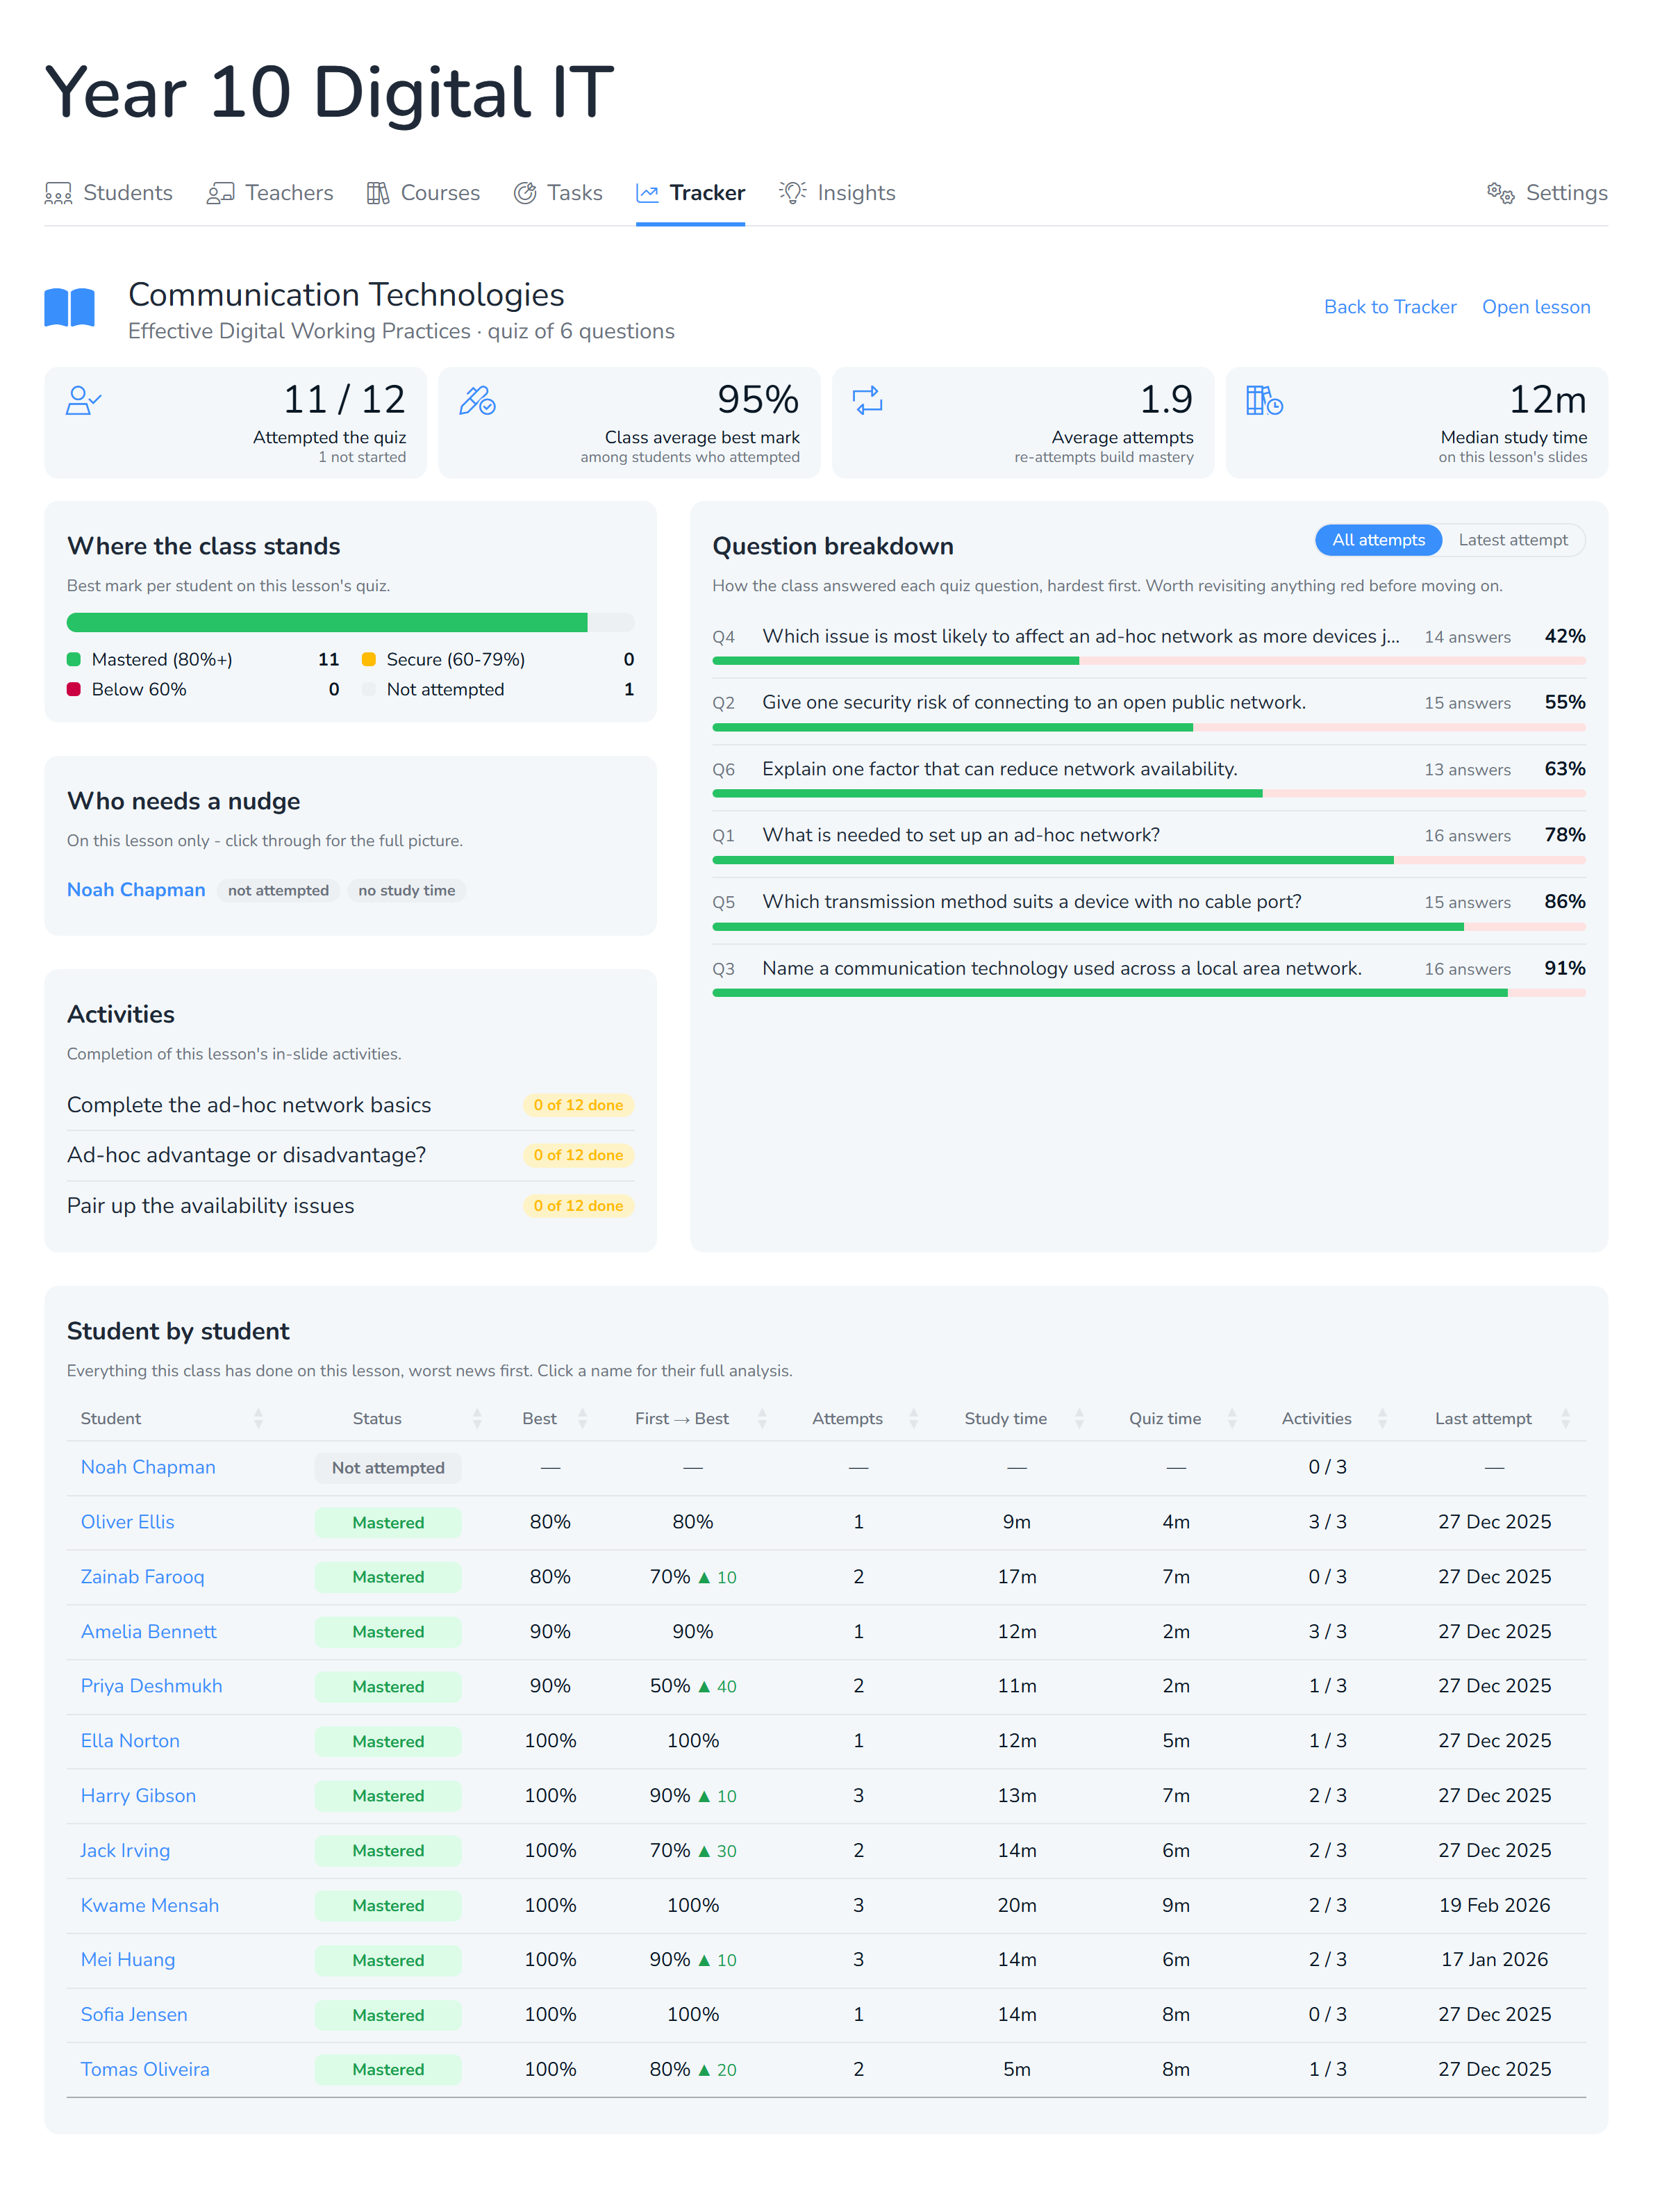
The summary cards
| Card | What it means |
|---|---|
| Attempted the quiz | How many of the class have had a go, and how many have not |
| Class average best mark | The class average for this lesson |
| Average attempts | How many tries students needed |
| Median study time | Typical time on this lesson's slides and activities |
Where the class stands
A single bar splits the class four ways: mastered at 80% or above, secure between 60% and 79%, below 60%, and not attempted.
This tells you whether a middling class average hides a split class. An average of 68% could mean everyone scored about 68%, or it could mean half mastered it and half failed. Those need very different follow-up lessons.
Question breakdown
This is the part that is hard to get any other way.
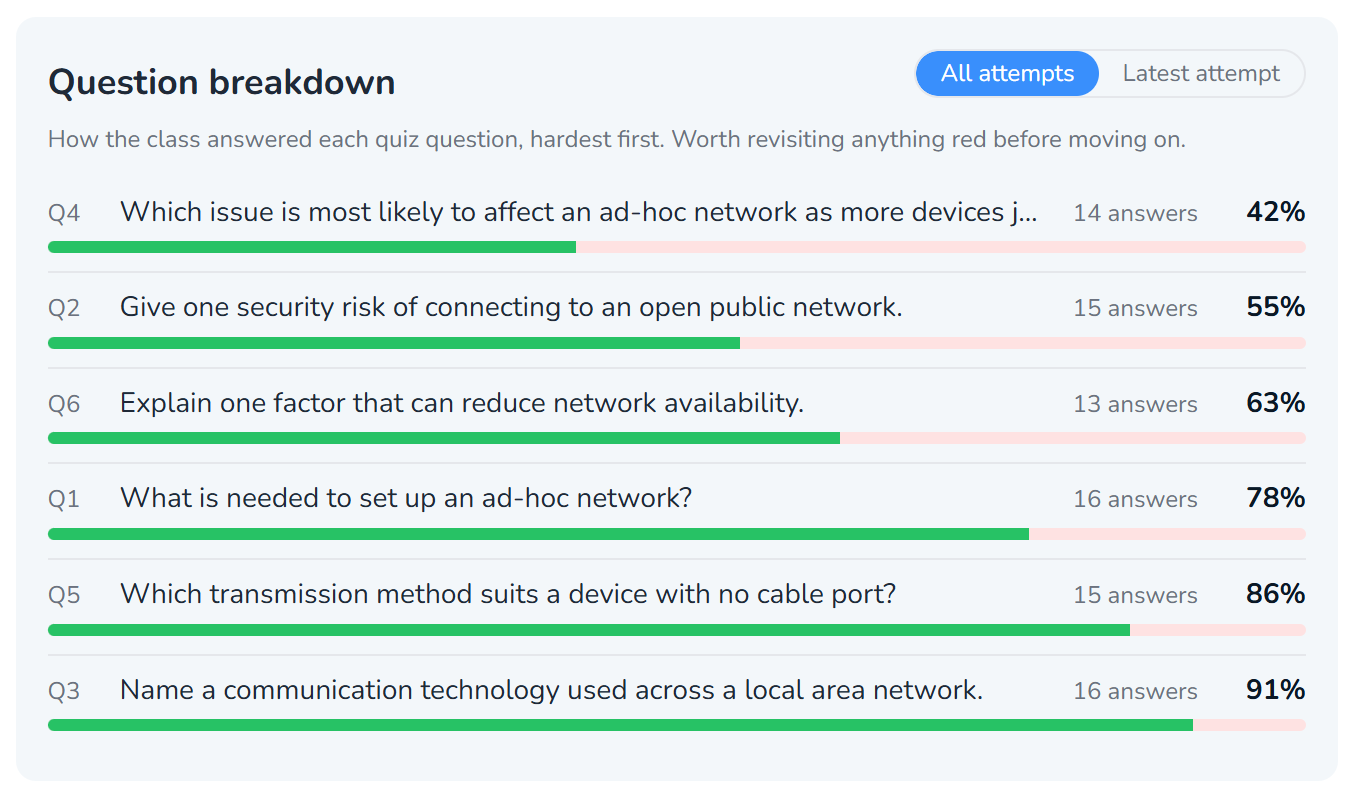
Every question in the lesson's quiz is listed hardest first, with the percentage of answers that were correct and a bar showing right against wrong.
A class average tells you to re-teach the lesson. This tells you which part of the lesson to re-teach. If one question sits at 36% while the rest are above 70%, you have found a single specific misconception rather than a general weakness.
All attempts or latest attempt
The toggle at the top right changes what is counted.
- All attempts includes every try, so it shows where students started out. This is the better guide to what caused difficulty.
- Latest attempt counts only each student's most recent try, so it shows where they are now, after any re-attempts.
The answer count changes with the toggle, since the two views cover different numbers of answers.
Who needs a nudge
Alongside the breakdown is a short list of the students who struggled most with this lesson specifically, with a note of why each is flagged. Click a name to open their full analysis.
This is more focused than the class-wide attention list, because it only considers this one lesson.
Activities
If the lesson contains interactive activities, you also see how many of the class completed each one. Low completion here alongside low quiz marks usually means students went straight to the quiz without doing the practice.
Student by student
At the bottom, a sortable table covers everyone in the class for this lesson: status, best mark, first mark, attempts, time, activities and last attempt date.
The First to Best column is worth a look. A student who went from 30% to 90% has responded well to re-attempting, and that is worth different feedback from a student who scored 60% once and stopped.
Click a column heading to sort. Click a name to open their page.
Screens in this guide use a demonstration class. Your own class names, students and data will differ.